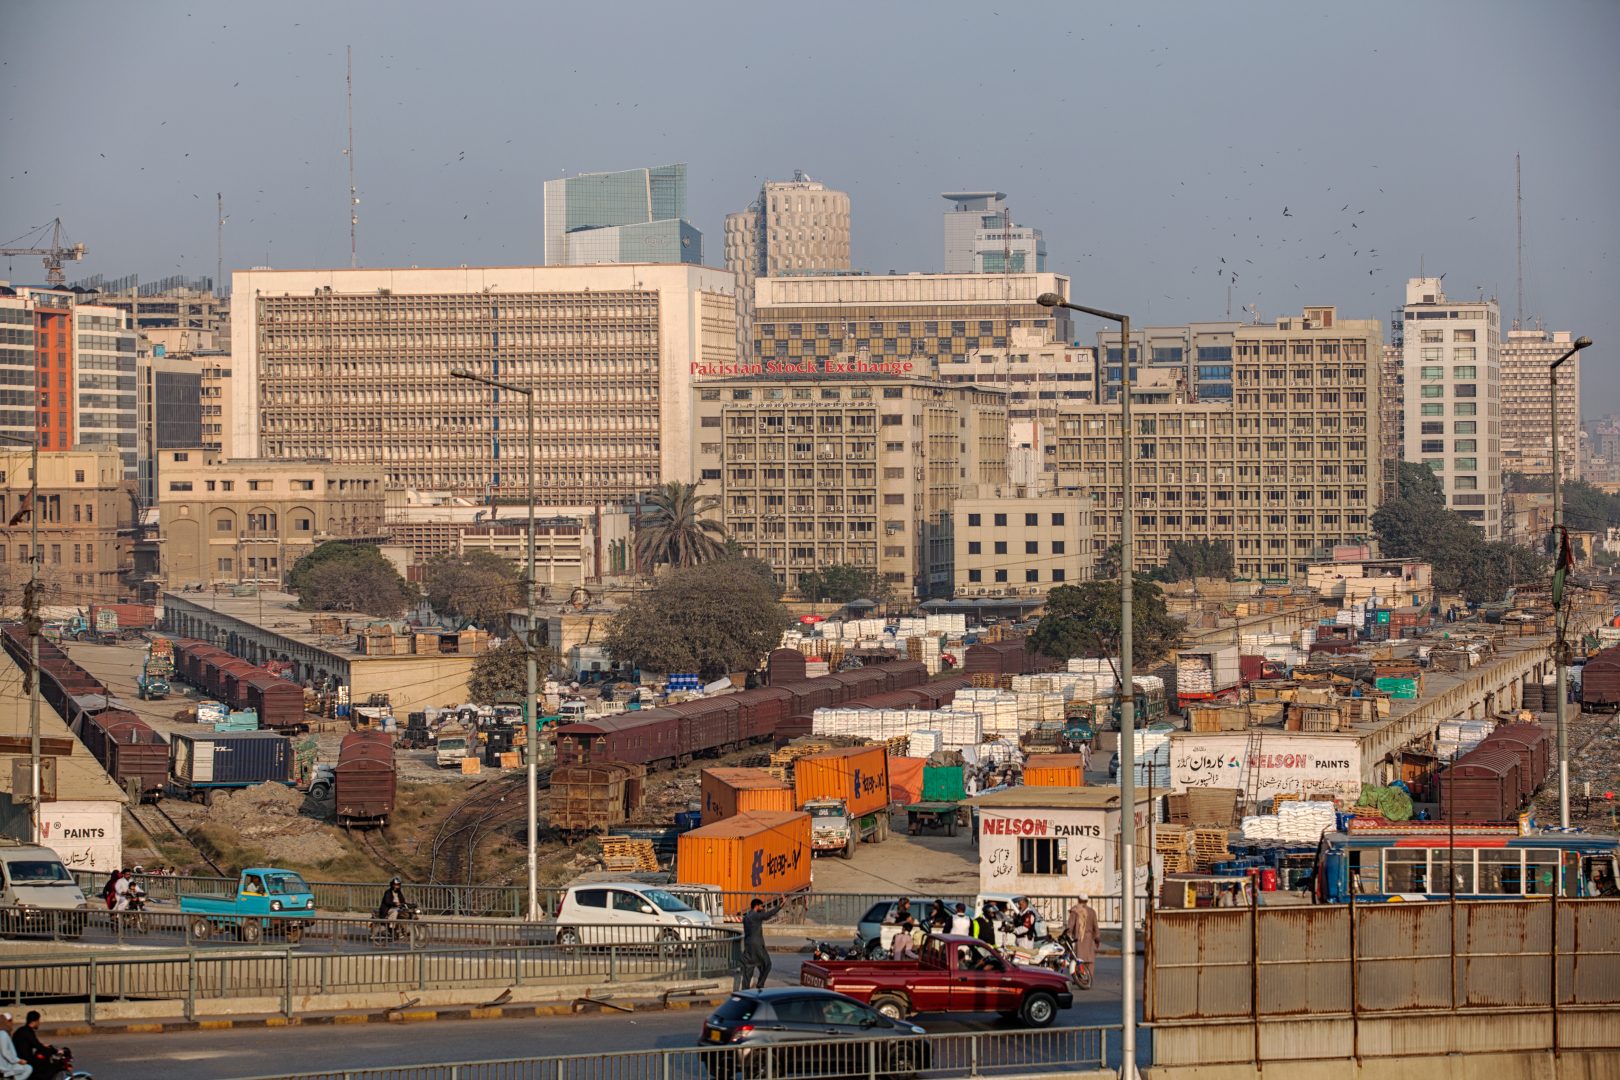
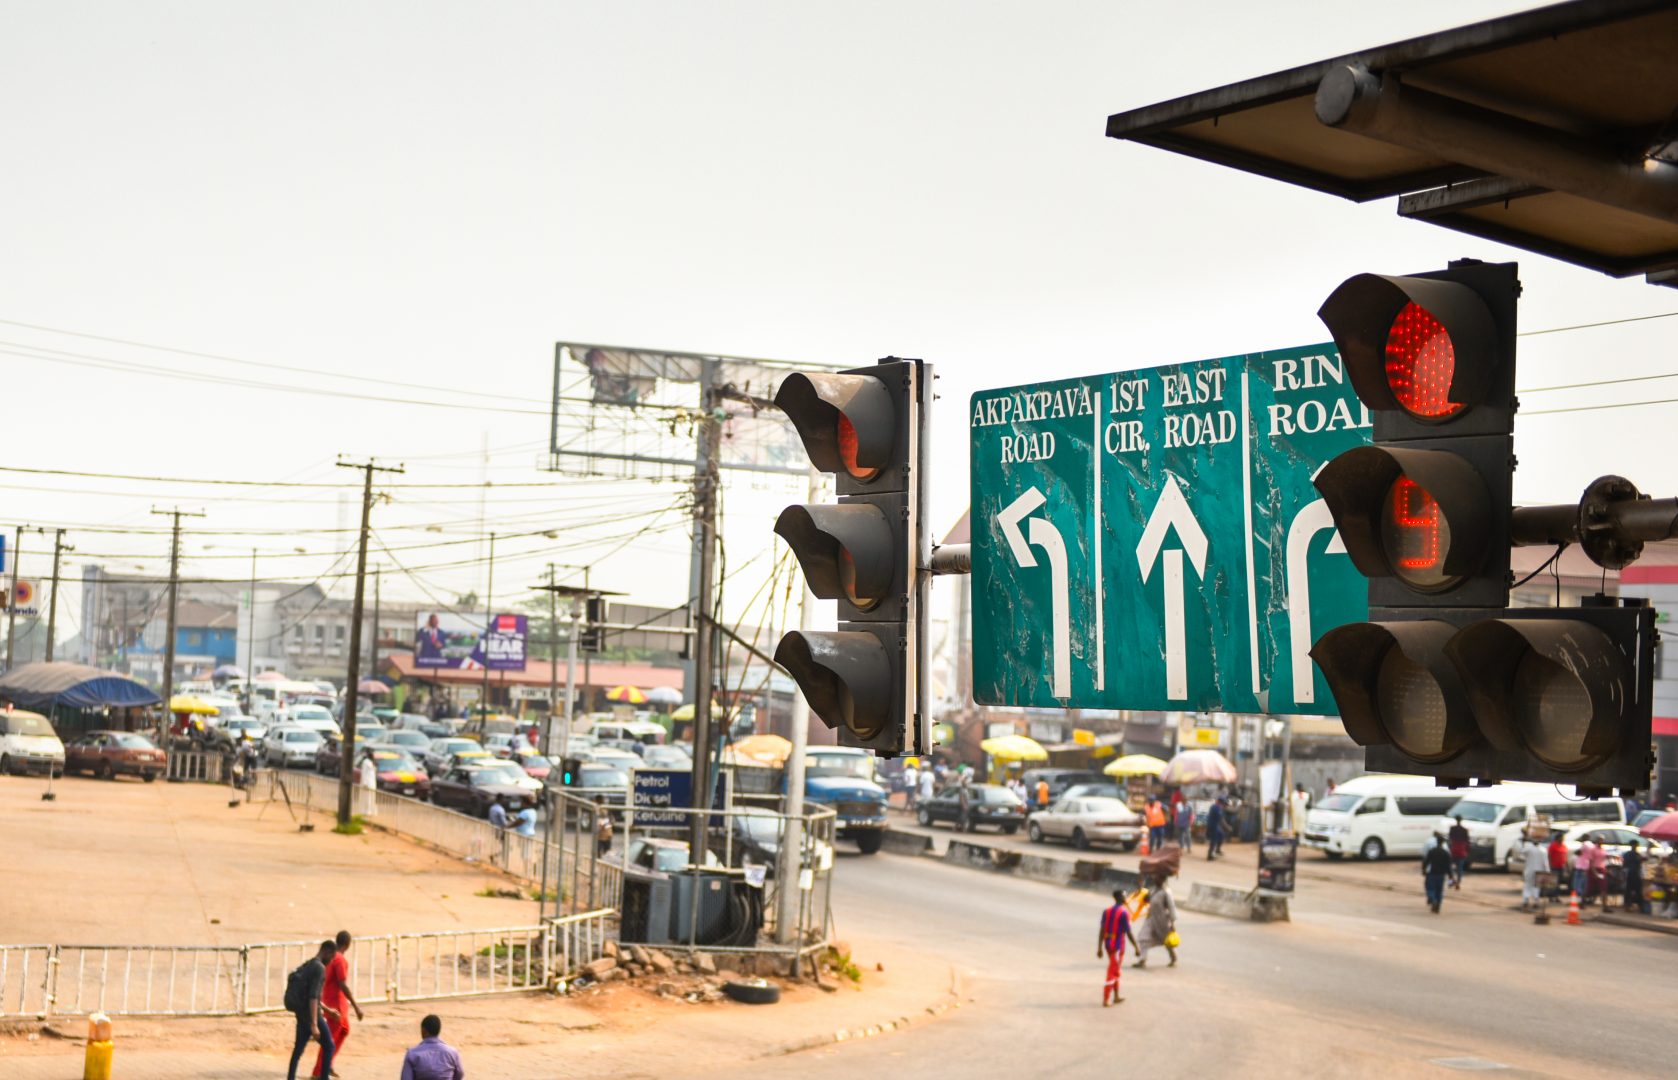
INDIVIDUAL(S) PHOTOGRAPHED: N/A. LOCATION: Jinnah Bridge, I. I. Chundrigar Road, Karachi, Pakistan. CAPTION: An elevated view shows the business and financial hub of Karachi, Pakistan.
Markets in South and South East Asia during the first half of 2018
This article provides a snapshot of what’s been happening in the markets in South and South East Asia that we invest in during the first half of 2018. It draws on data and analysis from CDC, as well as the thoughts of people we work with on the ground.
By Adam Fegan and Taylor Ruan.
Macro environment
The region’s largest economy continues to grow
In South Asia’s leading economy, India, growth is accelerating (Table 4) – driven by improving business confidence, robust private consumption and increased public spending. However, government spending and private consumption are behind the causes, rather than the capex cycle, which is yet to take off due to limited demand from the private sector. So, it’s important to look at this growth with a degree of caution.
Robust growth in other countries in the region
For Pakistan, the newly elected prime minister, Imran Khan, is seeking to boost export and investments to increase foreign-exchange reserves, decrease the fiscal deficit and overcome the country’s debt crisis. Real GDP is predicted to grow by an annual average of 5.4 per cent in Pakistan over the next four years (Table 4).
The political situation in Bangladesh – where tensions between the two main parties flared up in the early part of the year – has improved. Although risks remain, which investors need to monitor, these are largely due to threats of a terrorist attack and social unrest, caused by labour protests and rising energy prices. Investors should also be aware that delays in VAT reforms will make it difficult for the government to realise its revenue expectations for the year. More positively for those interested in economic developments in the country, rapid infrastructure development over the next three years will likely spur economic growth.
Among other countries in the wider region, Vietnam and Myanmar have also seen robust economic growth. Vietnam has been backed by strong exports, inflows of foreign direct investment and private consumption. Meanwhile, Myanmar has benefitted from strong household consumption, despite continued political and social tensions.
An important year lies ahead
2018 and 2019 are crucial for India, Pakistan and Bangladesh. All three countries will be holding general elections where a strong opposition will be facing the incumbent party. This could have a major impact on the overall business agenda, so it’s important to stay aware of developments.
Figure 3: Major South Asian economies: Forecast summary
| Real GDP growth (%) (market exchange rate) | ||||||||||
| 2013A | 2014A | 2015A | 2016A | 2017A | 2018F | 2019F | 2020F | 2021F | 2022F | |
| India | 6.4 | 7.4 | 8.1 | 7.1 | 6.7 | 7.3 | 7.7 | 7.4 | 7.6 | 7.8 |
| Pakistan | 4.4 | 4.7 | 4.7 | 5.5 | 5.7 | 5.4 | 5.0 | 4.9 | 5.5 | 6.3 |
| Bangladesh | 6.0 | 6.1 | 6.6 | 7.1 | 7.3 | 7.7 | 7.7 | 7.0 | 6.9 | 7.4 |
| Vietnam | 5.4 | 6.0 | 6.7 | 6.2 | 6.8 | 6.9 | 6.5 | 5.8 | 6.0 | 6.1 |
| Myanmar | 8.4 | 8.0 | 7.0 | 5.7 | 6.5 | 6.9 | 7.2 | 7.0 | 7.4 | 7.2 |
Source: EIU
Private equity market
Indian PE market performing well – on the surface
On the surface, it seems that the private equity market in India is performing well. Fundraising increased by 30 per cent to $4.3 billion and deal value reached an historical high of $26.4 billion in 2017. However, this activity has been concentrated to just a few managers and across a small number of deals – for example, 15 deals constituted 50 per cent of deal value last year. Raising capital from institutional and foreign investors has become increasingly difficult and the full spectrum of funds (large, mid and small-cap) are struggling.
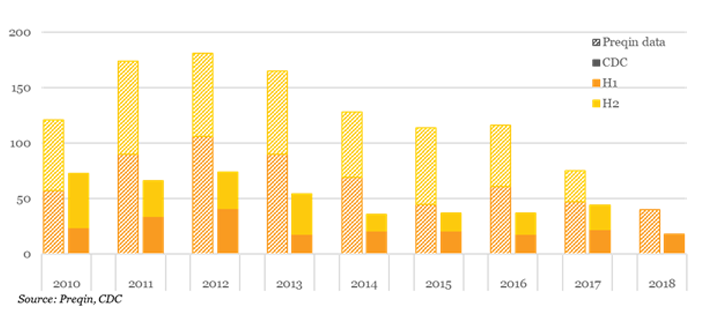
Across the region, deal flow has been slow in H1 2018, making it the slowest first half of the year in terms of number of completed transactions, according to Preqin (Figure 3).
Figure 3: Deal flow in South Asia by count: Preqin data vs. companies invested by CDC – 2010 to H1 2018
Public market
The MSCI India index reached historic heights at the beginning of 2018 (Table 5 and Table 6), however we then saw market corrections in the following few months, especially with regards to small and mid-cap. This is a result of a variety of factors such as persistent selling by foreign institutional investors, unsustainable high valuations and decreasing rupee value against the US dollar. Despite these concerns, India has generated positive three-month returns, driven primarily by consumer staples, healthcare and information tech.
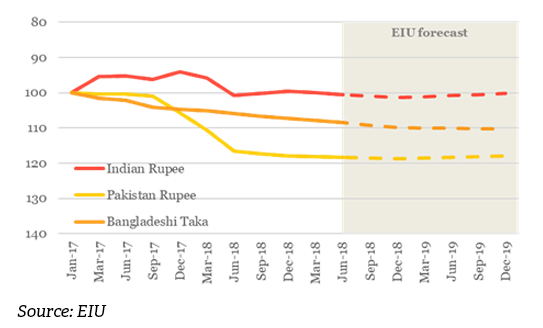
More broadly, the EIU’s forecast suggests that South Asian currencies will remain stable in short term (Figure 4).
Table 5: MSCI returns by region/ country (%) – as at the end of June 2018
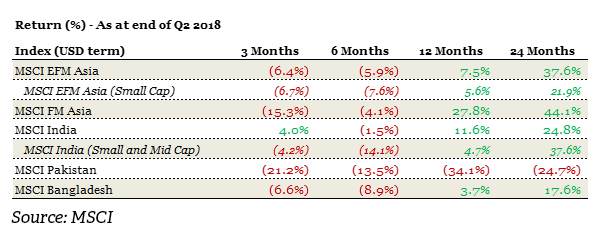
Table 6: MSCI India return by sector (%) – as at the end of June 2018
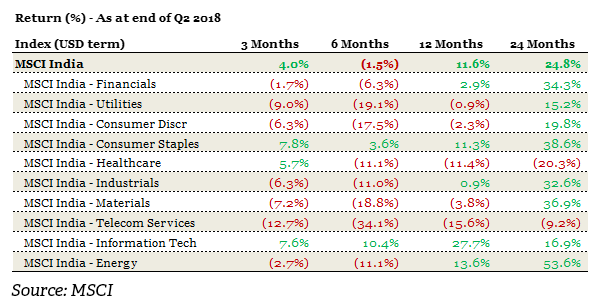
Figure 4: Currency movements – rebased at 1 January 2017
