Market snapshot: Africa
What's been happening in our markets?
Markets in Africa during the second half of 2018
Here we call out the biggest macroeconomic themes in the second half of 2018. Drawing on our own data and analysis, information from third parties, as well as the views of our experienced teams, we provide a unique view on our core markets in the region.
By Taylor Ruan.
Macro enviroment
Growth continues
Economic growth in Sub-Saharan Africa continued and is estimated to have reached 2.7% in 2018 (Table 1). This upward trajectory was in the face of significant oil price fluctuations due to Saudi Arabia’s oversupply. Consequently, oil exporting countries such as Nigeria and Angola suffered economically.
The Continent’s economic outlook is mixed. However, we are especially encouraged by:
- Growth in East and West Africa, where some of the world’s fastest-growing economies are located, such as Ethiopia and Ghana.
- The recent recovery in oil prices, which is boosting African oil exporters and related industries such as power transmission and infrastructure.
- The growing momentum of commercial investment, consumer demand and net exports, which are all key drivers of sustainable economic growth in Africa.
Table 1: Sub-Saharan Africa economy: Forecast summary
| Real GDP Growth (%) at market price | 2016A | 2017A | 2018E | 2019F | 2020F | 2021F |
| Sub-Saharan Africa (SSA)[1] | 1.3 | 2.6 | 2.7 | 3.4 | 3.6 | 3.7 |
| SSA ex. Nigeria, South Africa, and Angola | 4.3 | 4.7 | 4.7 | 5.4 | 5.4 | 5.4 |
| Oil exporters[2] | -0.7 | 1.4 | 1.7 | 2.9 | 2.8 | 2.8 |
| CFA countries[3] | 2.9 | 3.3 | 3.8 | 4.9 | 4.7 | 4.6 |
| SSA3 | -0.8 | 0.9 | 1.1 | 1.9 | 2.1 | 2.1 |
| Nigeria | -1.6 | 0.8 | 1.9 | 2.2 | 2.4 | 2.4 |
| South Africa | 0.6 | 1.3 | 0.9 | 1.3 | 1.7 | 1.8 |
| Angola | -2.6 | -0.1 | -1.8 | 2.9 | 2.6 | 2.8 |
[1] GDP at market prices and expenditure components are measured in constant 2010 U.S. dollars. Average including countries with full national accounts and balance of payments data only. Excludes Central African Republic, São Tomé and Príncipe, Somalia, and South Sudan.
[2] Includes Angola, Cameroon, Chad, Republic of Congo, Gabon, Ghana, Nigeria, and Sudan.
[3] Includes Benin, Burkina Faso, Cameroon, Central African Republic, Chad, Republic of Congo, Côte d’Ivoire, Equatorial Guinea, Gabon, Mali, Niger, Senegal, and Togo.
Political uncertainties may impact economies
There are 18 national or presidential elections taking place in Africa throughout 2019 (Table 2), including those in the continent’s largest economies, Nigeria and South Africa. Undoubtedly, political tensions will rise and may negatively impact investors’ sentiment towards Africa. We highlight the following political changes as key to the continent’s stability:
- February 2019 saw the re-election of Nigeria’s president Muhammadu Buhari, who recently announced plans to sell shares in oil ventures with international companies to accelerate his country’s energy reforms.
- In the Democratic Republic of the Congo, tensions have heightened following the controversial election that took place there at the end of 2018.
- Zimbabwe’s policy-related macroeconomic instability, funding shortages and inadequate infrastructure continue to severely constrain hopes for the country’s return to stability.
- The terrorist attacks which took place in Nairobi could further weaken Kenya’s investment climate.
Countries such as Botswana and Ghana maintain a relatively healthy political environment. As such, their economies are comparatively stable.
Table 2 : List of national/ presidential elections in Africa in 2019
| Parliamentary election | Presidential election | ||||
| Country | Last election | Next election | Last election | Next election | |
| Algeria | May 2017 | 2022 | Apr 2014 | Apr 2019 | |
| Botswana | Oct 2014 | Oct 2019 | |||
| Cameroon | Sep 2013 | Oct 2019 | Oct 2018 | Oct 2025 | |
| Guinea | Sep 2013 | 2019 | Oct 2015 | 2020 | |
| Guinea-Bissau | Apr 2014 | Mar 2019 | |||
| Libya | Jun 2014 | Jun 2019 | |||
| Madagascar | Dec 2013 | Mar 2019 | |||
| Malawi | May 2014 | May 2019 | |||
| Mali | Dec 2013 | Apr 2019 | Jul 2018 | 2023 | |
| Mauritania | Nov 2013 | Jun 2014 | 2019 | ||
| Mauritius | Dec 2014 | 2019 | |||
| Mozambique | Oct 2014 | Oct 2019 | |||
| Namibia | Nov 2014 | Nov 2019 | |||
| Nigeria | 2015 | Feb 2019 | Apr 2015 | ||
| Senegal | Jul 2012 | 2019 | Feb 2012 | Feb 2019 | |
| Somalia | 2016 | Apr 2019 | 2017 | 2019 | |
| South Africa | Apr 2014 | 2019 | |||
| Tunisia | Oct 2014 | Oct 2019 | Nov 2014 | Dec 2019 | |
Private Equity Market
Fundraising climate remains challenging
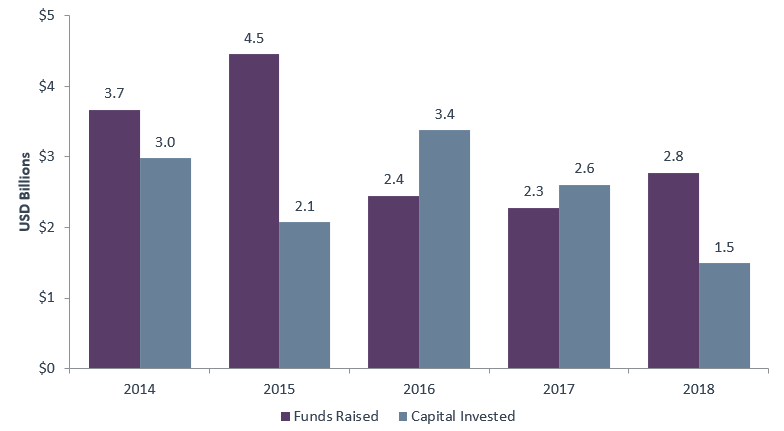
Africa’s fundraising climate continued to be challenging throughout 2018, directly related to the slowdown of growth in emerging markets generally. EMPEA reported an increase in funds raised in Africa, rising from $2.3bn in 2017 to $2.8bn in 2018. However, this remains well below 2015’s high of $4.5bn and the overall investment landscape is not encouraging. In the first three quarters of 2018, $1bn was raised in Africa – which represents a 42% year-on-year decline, highlighting the fundraising challenges.
Political uncertainty will continue to have a negative impact on fundraising in 2019. However, venture capital looks set to be comparatively attractive to investors, spurred by growth in the technology sector in Sub-Saharan Africa.
Africa Fundraising and Investment: 2014-2018
Source: EMPEA
Deal flow continuously declined in recent years
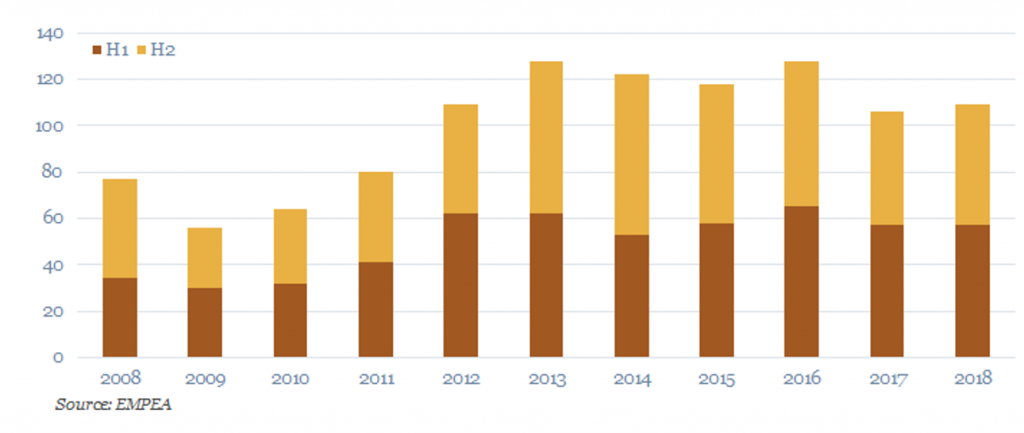
Deal flow remained at the same level in 2018 compared to the year before. However, both 2017 and 2018 saw a 15% decline compared to 2016. Last year fewer buyout deals took place across the continent compared to 2017, while growth deals saw decline in both 2017 and 2018 – appetite from strategic buyers waned due to the uncertainty in regional economies and a challenging exit environment.
Figure 1: Deal flow in Africa (number of deals) – 2010 to 2018
Despite this, we have continued the deployment of our funds through flexible and bespoke investment solutions. CDC contributed more than 5% of all capital raised by funds targeting the African region with vintages between 1991 and 2018 and have invested in approximately 22% of all funds that have reached financial close during the same period.
Public Market
Prepare for mid-term market volatility in Africa
The MSCI indices show that the African equity market declined significantly in 2018. This reflected investors’ concerns over domestic political uncertainty as well as the continuous slowdown in emerging markets. The strong US dollar and the US-China trade dispute continue to weigh on investors’ risk appetite. We have observed a minor recovery in African markets in early 2019 and anticipate mid-term volatility.
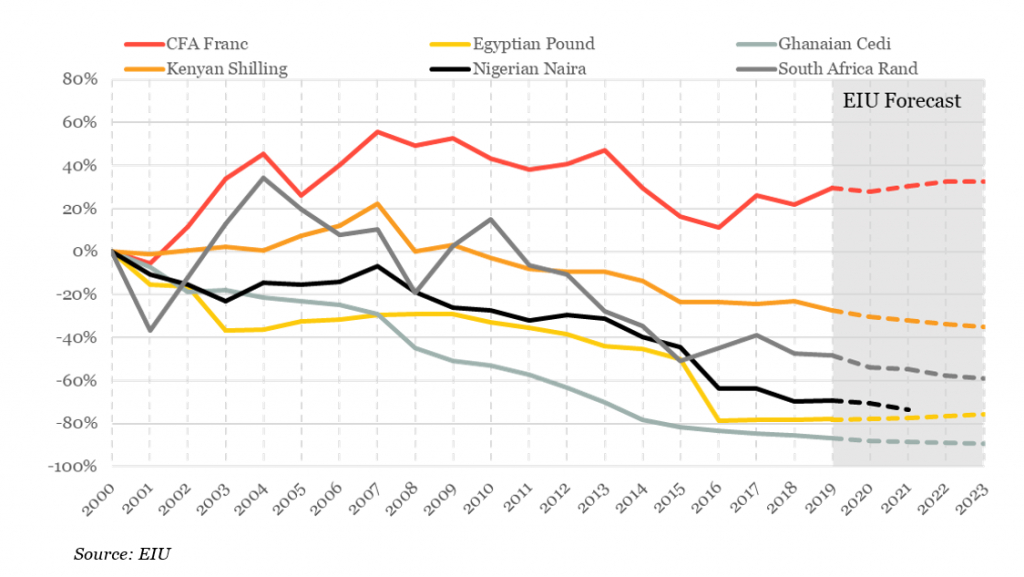
Currencies in major African currencies are estimated to further depreciate in the mid-term, except for the CFA Franc and Egyptian Pound, according to EIU (Figure 2).
CDC, as a long-term investor, will continue supporting businesses in the continent despite market volatility.
Table 3: MSCI returns by region/ country (%) – as at the end of December 2018
| Index (USD terms) | 1 Month | 3 Months | 6 Months | 12 Months | 24 Months |
| MSCI EFM | (2.9%) | (7.6%) | (9.6%) | (16.6%) | 11.8% |
| MSCI EFM Africa | (0.8%) | (4.1%) | (12.2%) | (25.6%) | (2.0%) |
| MSCI EFM Africa – Small Cap | (2.6%) | (6.2%) | (11.7%) | (25.2%) | (13.4%) |
| MSCI FM Africa | (1.5%) | (4.1%) | (13.5%) | (16.1%) | 1.6% |
| MSCI FM Africa – Small Cap | 1.0% | (6.2%) | (17.4%) | (20.4%) | (2.5%) |
| MSCI South Africa | 3.0% | (2.8%) | (7.6%) | (14.6%) | 2.9% |
| MSCI South Africa – Small Cap | 0.2% | (4.5%) | (3.8%) | (14.3%) | (11.7%) |
| MSCI Nigeria | 0.4% | (3.7%) | (17.1%) | (17.4%) | 23.4% |
| MSCI Nigeria Small Cap | 4.5% | (4.5%) | (24.4%) | (23.1%) | 12.1% |
| MSCI Kenya | (7.5%) | (8.6%) | (23.2%) | (16.9%) | 8.6% |
| MSCI Kenya Small Cap | (1.4%) | (3.4%) | (18.8%) | (21.8%) | 6.6% |
Source: MSCI
Table 4: MSCI FM Africa return by sector (%) – as at the end of December 2018
| Index (USD terms) | 1 Month | 3 Months | 6 Months | 12 Months | 24 Months |
| MSCI FM Africa | (1.5%) | (4.1%) | (13.5%) | (16.1%) | 1.6% |
| MSCI FM Africa – Communication Svcs | (3.9%) | (7.6%) | (16.3%) | (11.8%) | 3.5% |
| MSCI FM Africa – Consumer Staples | (0.6%) | (3.2%) | (15.5%) | (20.3%) | (16.2%) |
| MSCI FM Africa – Energy | 8.7% | 2.1% | (0.5%) | (3.1%) | 17.1% |
| MSCI FM Africa – Financials | (1.9%) | (4.0%) | (12.9%) | (10.7%) | 20.6% |
| MSCI FM Africa – Materials | 4.2% | 0.2% | (13.0%) | (19.2%) | (16.2%) |
| MSCI FM Africa – Utilities | 1.2% | 1.2% | 0.2% | (5.6%) | 20.6% |
Source: MSCI
Figure 2: Currency movements – rebased at 31/12/2000
