Market snapshot: South Asia
What's been happening in our markets?
Markets in South Asia during the second half of 2018
Here we call out the biggest macroeconomic themes in South Asia in the second half 2018. Drawing on our own data and analysis, information from third parties, as well as the views of our experienced teams, we provide a unique view on our core markets in the region.
By Taylor Ruan.
Macro Environment
The region’s largest economy to be global growth leader
India is South Asia’s leading economy. It is forecast to maintain its position as one of the world’s fastest-growing major economies (Table 1). According to the World Bank, Indian real GDP growth is forecast to be 7.5% in 2019 and will remain strong, as the country benefits from lower oil prices, an ease in inflation as well as the slower-than-expected monetary tightening.
The general election in May 2019 is key to the political stability of the country, as Prime Minister Modi works to stabilise market volatility, allay uncertainties on global trade and maintain India’s robust fiscal discipline.
Lower growth forecast in other South Asian economies
Other South Asian economies haven’t performed so well.
Pakistan’s 2019 growth expectations are lower as foreign exchange reserves decline, the current account deficit remains high and pressure on the Pakistani Rupee intensifies. The longer-term outlook paints a more encouraging picture as economic growth may be driven by the country’s robust consumer demand, increasing exports and improvements in infrastructure.
The Bangladeshi economy performed strongly in 2018 driven by consumer demand, increasing exports and remittance inflows. Yet, the struggling banking system, the impact from the weak global trade environment and risks of natural disasters may cloud growth in the medium-term.
Growth forecasts are lower in other South Asian economies due to the impacts from the weakening global trade environment. However, the economic growth prospects for Vietnam and Myanmar are expected to remain at over 6.5% p.a. from 2019 to 2021. More specifically, the growth of Vietnam is propelled by stronger private consumption, on-track economic restructuring and an improving business environment. In Myanmar, growth is forecast to pick up in the mid-term supported by both domestic and foreign investments, stimulated by recent policy measures.
Table 1: Major South Asian economies: GDP forecast summary
| Real GDP Growth (%) | 2016A | 2017A | 2018E | 2019F | 2020F | 2021F |
| South Asia | 7.5 | 6.2 | 6.9 | 7.1 | 7.1 | 7.1 |
| India[1] | 7.1 | 6.7 | 7.3 | 7.5 | 7.5 | 7.5 |
| Pakistan[2] | 4.6 | 5.4 | 5.8 | 3.7 | 4.2 | 4.8 |
| Bangladesh2 | 7.1 | 7.3 | 7.9 | 7.0 | 6.8 | 6.8 |
| Myanmar | 5.9 | 6.8 | 6.2 | 6.5 | 6.6 | 6.8 |
| Vietnam | 6.2 | 6.8 | 6.8 | 6.6 | 6.5 | 6.5 |
Source: World Bank
[1] The column labelled 2016 refers to FY2016/17.
[2] GDP growth values are on a fiscal year basis. Aggregates that include these countries are calculated using data compiled on a calendar year basis. Pakistan’s growth rates are based on GDP at factor cost. The column labelled 2017 refers to FY2016/17.
Private Equity Market
India’s vibrant private equity market
Last year, the Indian private equity market performed well in terms of fundraising and deal flow. EMPEA data highlights that fundraising in 2018 rose to $6.7bn compared to $5.5bn in 2017 and the capital invested increased 46% to nearly $13bn. Buyout deals ballooned last year, accounting for nearly half of capital invested in 2018. Interestingly, capital raised was from a highly concentrated group of managers and the capital invested was subject to a small number of very large deals. In the first three quarters of 2018, the ten largest funds raised over 70% of the total capital; the largest ten investments represented over 50% of total capital invested.
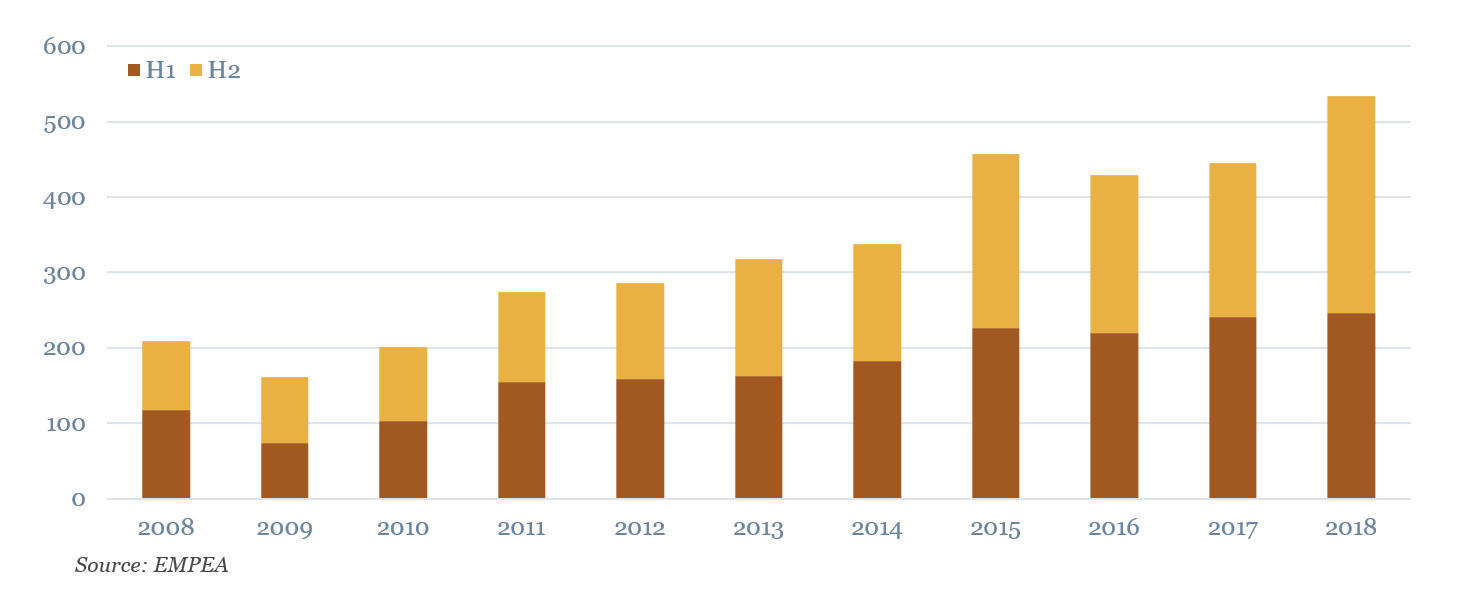
Deal flow in the second half of 2018 was stronger compared to the first half, which led the total number of deals completed in 2018 20% higher vs 2017, according to EMPEA data (Figure 1). CDC maintained a strong investment pace in South Asia, investing in an average of around 40 businesses per year since 2014.
Figure 1: Deal flow in South Asia by count H1 and H2 2018 – data from EMPEA
Public Market
Market recovery continues
India’s public markets rebounded in October 2018 following a 15% slide from all-time highs in August. The remainder of Q4 exhibited signs of a mild market recovery, especially in the small and mid-cap space, albeit under volatile conditions.
Structural challenges within the Indian financial services industry remain, such as the ongoing reform measures. Growth in bank lending has stuttered following complexities in the debt markets. However, a more encouraging picture is emerging as recent bankruptcy fears and stress in the non-banking financial sector has alleviated since mid-October.
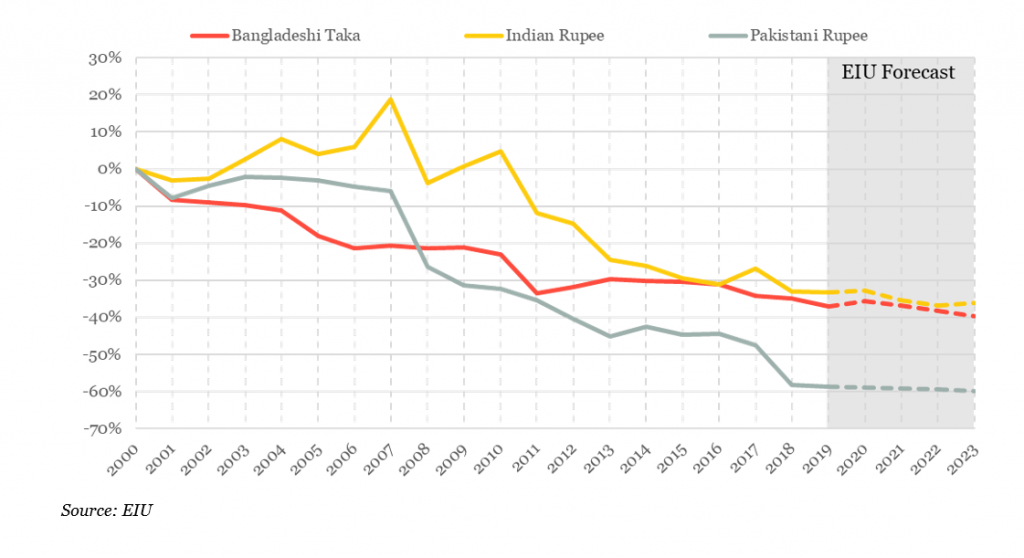
The highly volatile Indian Rupee in 2018 lead to an 8% depreciation. In the near term, the EIU suggests that the annual depreciation rate during 2019 to 2021 will be around 1% p.a.
Table 2: MSCI returns by region/ country (%) – as at the end of December 2018
| Index (USD terms) | 1 Month | 3 Months | 6 Months | 12 Months | 24 Months |
| MSCI EFM | (2.9%) | (7.6%) | (9.6%) | (16.6%) | 11.8% |
| MSCI EFM Asia | (3.4%) | (9.5%) | (12.1%) | (17.2%) | 15.8% |
| MSCI EFM Asia – Small Cap | (1.9%) | (8.7%) | (13.8%) | (20.4%) | 5.7% |
| MSCI FM Asia | (4.1%) | (9.0%) | (10.3%) | (13.9%) | 22.0% |
| MSCI FM Asia – Small Cap | (0.3%) | (6.2%) | (6.5%) | (22.7%) | (10.6%) |
| MSCI India | (0.0%) | (2.3%) | 1.3% | 0.7% | 28.4% |
| MSCI India – Small and Mid Cap | 1.9% | 2.5% | (4.7%) | (17.2%) | 25.6% |
| MSCI Pakistan | (12.4%) | (23.4%) | (28.1%) | (38.4%) | (55.3%) |
| MSCI Pakistan – Small Cap | (10.9%) | (11.9%) | (15.0%) | (13.2%) | (31.1%) |
| MSCI Bangladesh | (1.8%) | (1.6%) | (6.9%) | (14.9%) | 3.9% |
| MSCI Bangladesh – Small Cap | 2.9% | 0.9% | (2.1%) | (20.5%) | (1.2%) |
Table 3: MSCI India return by sector (%) – as at the end of December 2018
| Index (USD terms) | 1 Month | 3 Months | 6 Months | 12 Months | 24 Months |
| MSCI India | (0.0%) | (2.3%) | 1.3% | 0.7% | 28.4% |
| MSCI India – Communication Svcs | (0.4%) | (0.7%) | (22.6%) | (48.3%) | (18.9%) |
| MSCI India – Consumer Discr | (0.7%) | 0.1% | (15.0%) | (29.1%) | (0.7%) |
| MSCI India – Consumer Staples | 2.0% | 10.2% | 5.1% | 9.8% | 54.2% |
| MSCI India – Energy | (1.8%) | (4.4%) | 7.0% | (3.9%) | 45.2% |
| MSCI India – Financials | 1.5% | 13.1% | 2.3% | (3.4%) | 38.7% |
| MSCI India – Healthcare | (4.7%) | (7.9%) | (6.4%) | (16.7%) | (19.4%) |
| MSCI India – Industrials | 1.1% | 16.7% | 4.3% | (6.7%) | 39.1% |
| MSCI India – Information Tech | (2.2%) | (8.3%) | 1.5% | 13.3% | 30.3% |
| MSCI India – Materials | (0.3%) | (0.2%) | (2.4%) | (19.6%) | 23.5% |
| MSCI India – Utilities | 6.5% | 0.5% | (0.1%) | (19.5%) | 5.7% |
Figure 2: Currency movements – rebased at 31/12/2000
