The transition to net-zero: explaining our current energy portfolio
As the UK’s development finance institution, we are committed to supporting countries and communities in a successful and just transition to net zero and resilient economies. We’ve invested over £750 million (over $1 billion) in climate finance since 2017, and in 2020 we published our Climate Change Strategy, which sets out our ambitious plan to achieve net zero emissions across our portfolio by 2050. Since then we have further strengthened our commitment by announcing our plan to invest over £3 billion of climate finance over the next five years to support emerging economies to combat the climate emergency. And our recently published strategy sets outs that over the next five years, at least 30 per cent of our total new commitments by value will be in climate finance.
One area we are frequently asked about is what our existing approach to climate change means for our portfolio of existing energy investments. That’s why last year we published a breakdown of our 2019 energy portfolio, to provide that data for all with an interest in our work, and we are now doing the same again for our 2020 energy portfolio. You can find a breakdown of our 2020 energy portfolio data here. The data (end December 2020) shows the total amount we’ve committed to our existing portfolio of energy companies, and the total value of those commitments.
Our energy portfolio in 2020
As we set out last year, our existing portfolio of energy investments shows that we had already begun the shift towards renewables in 2015, and the latest data shows how our more recent commitments on climate are accelerating this shift.
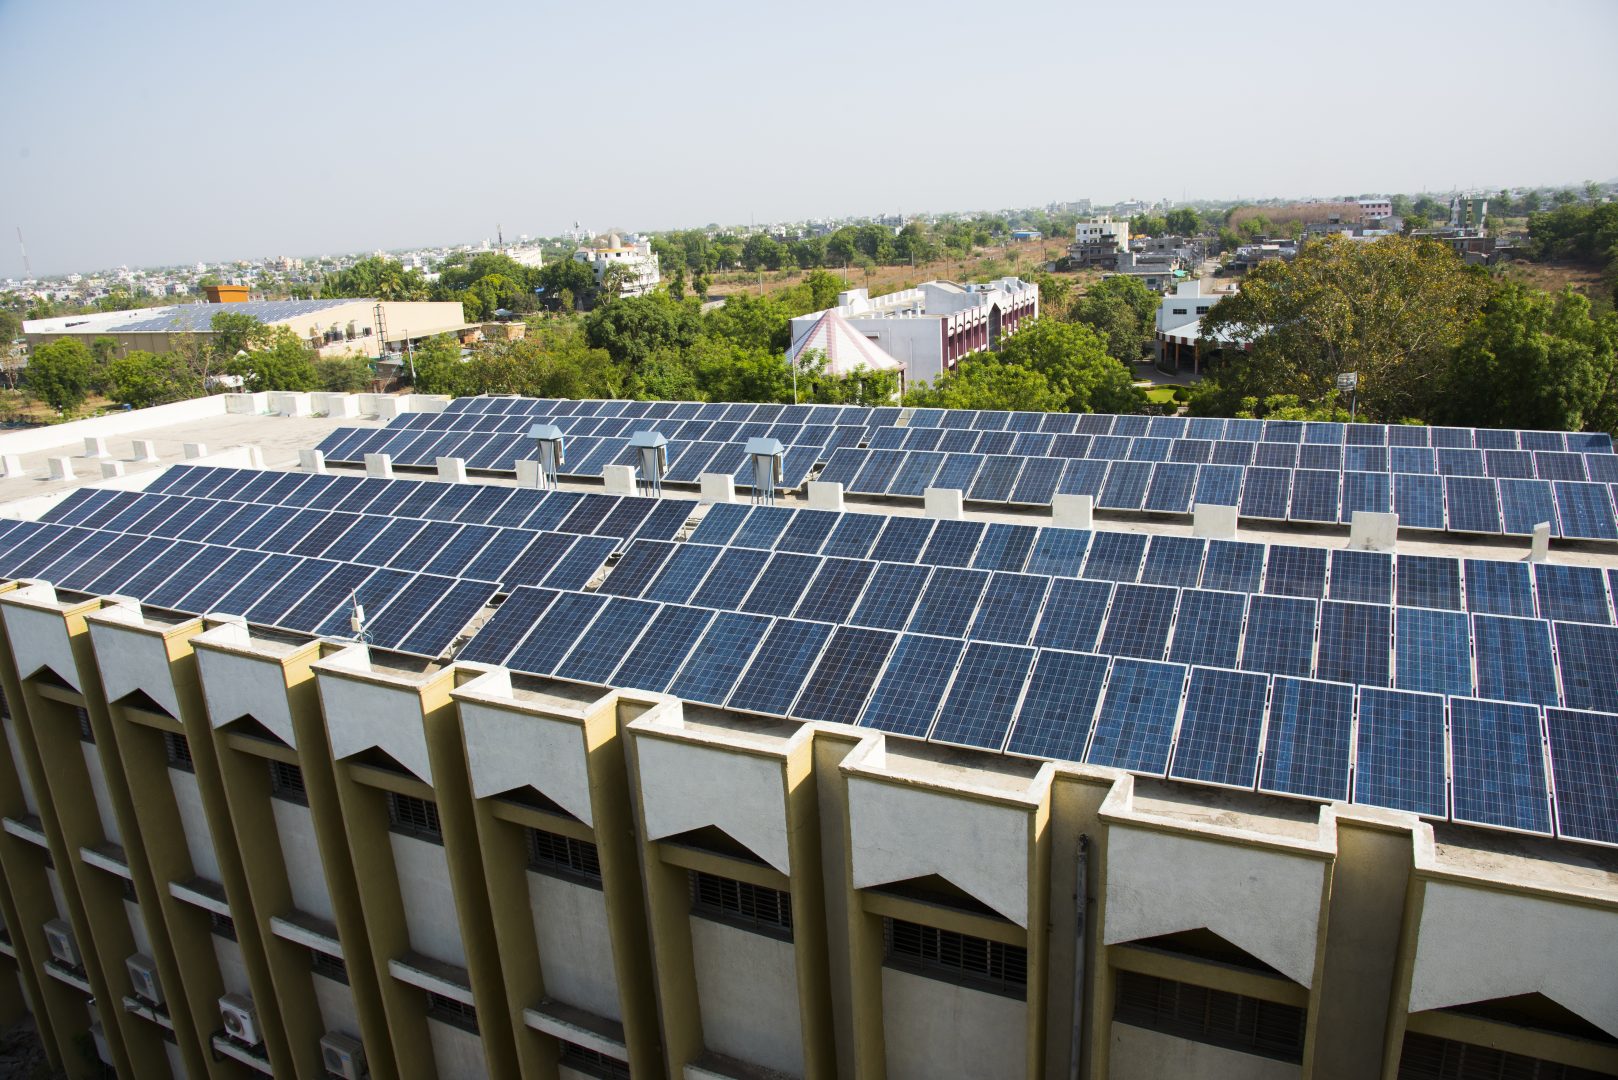
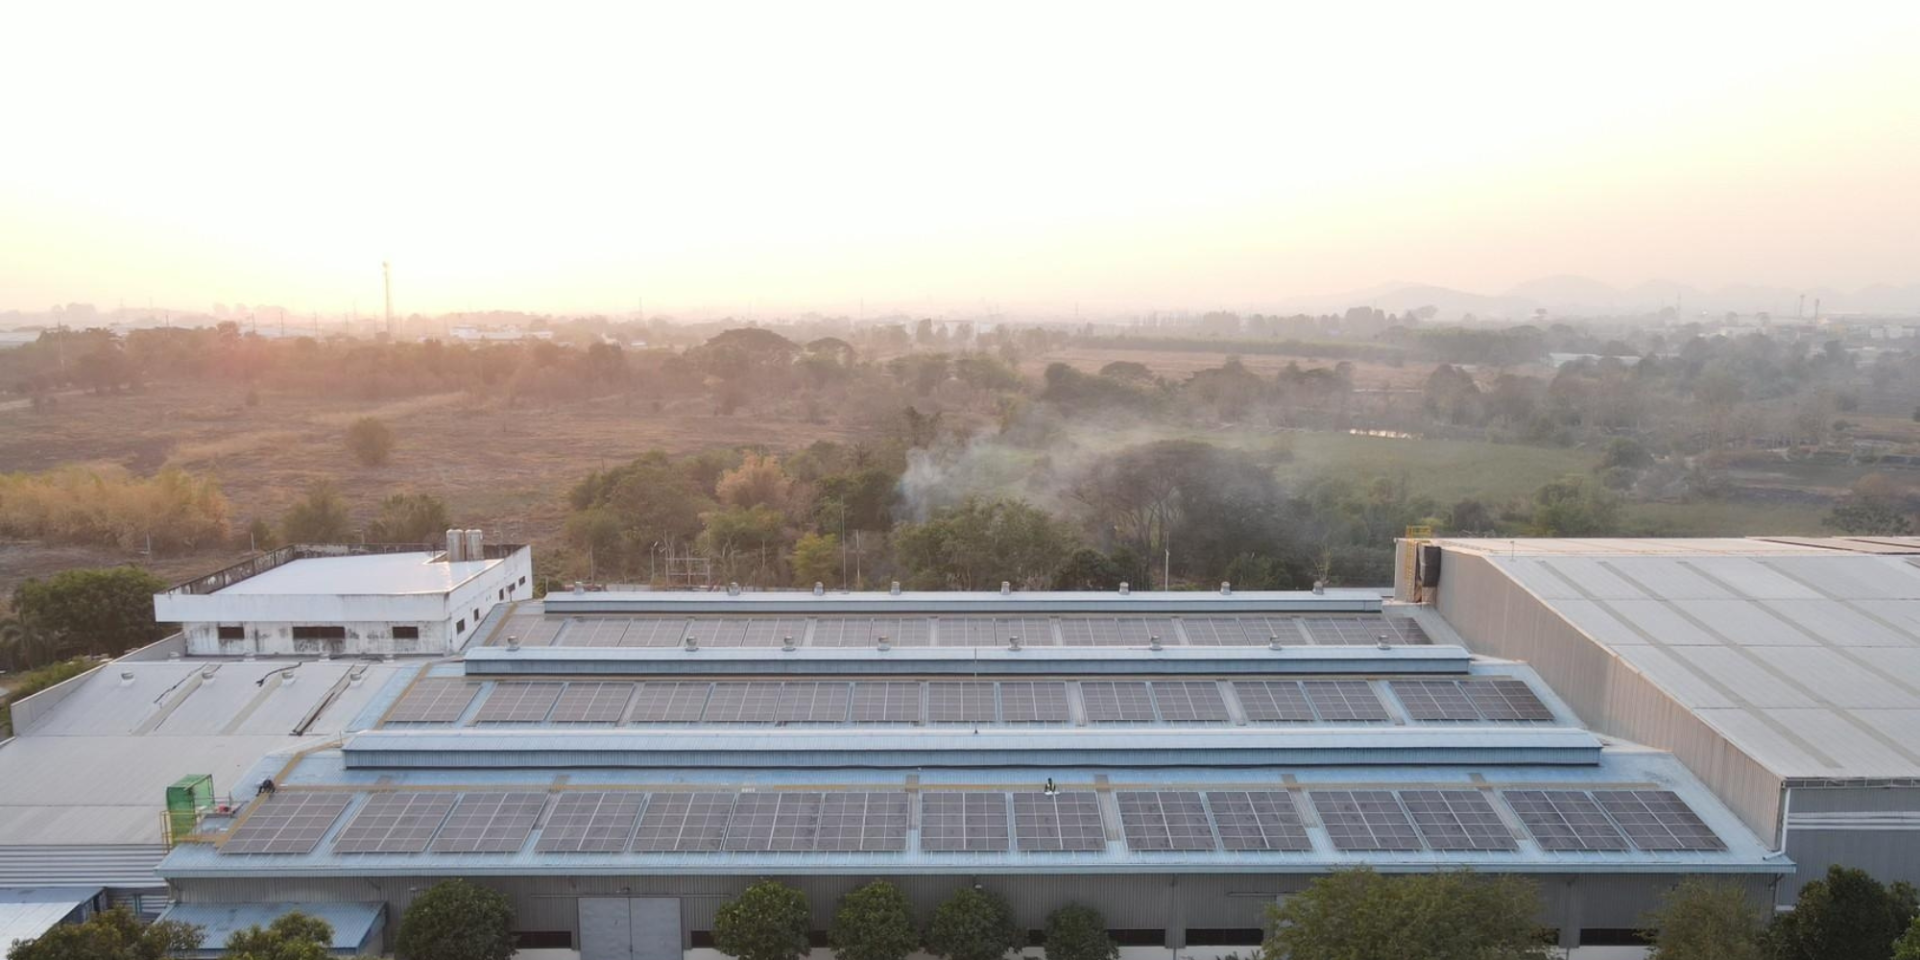
First, we continue to increase our commitments to renewable power, with our overall direct commitments to renewable energy at $894 million at the end of 2020. New commitments made in 2020 include an investment to support renewable power projects across Africa, and to support an off-grid solar company in East Africa. Beyond this dataset, when we include the commitments we made to renewable power in 2021, this brings the total amount of direct commitments to renewable energy to over $1.3 billion.
Second, the total value of our renewable energy portfolio ($955 million) now surpasses the value of our fossil fuel portfolio ($793 million) by 20 per cent. This is the reverse to last year where the renewable energy portfolio ($806 million) was 5 per cent smaller than the fossil fuel energy portfolio ($846 million). This reversal has been achieved by the value of the renewable energy portfolio increasing by $149 million since last year, up 18 per cent; while the value of the fossil fuel portfolio has decreased by $53 million, down 6 per cent. The value of our renewable energy portfolio has increased with respect to both our direct portfolio and our indirect portfolio, in other words our investments through funds.
We expect this gap to continue to widen as we invest in line with our commitment to 30 per cent of new investments in climate finance and as drawdowns are made on our recent renewable energy investments. On the flip side, our Climate Change Strategy and Fossil Fuel Policy exclude new investments in the vast majority of fossil fuels. So as our older fossil fuel energy investments exit the portfolio, this will also contribute to the widening gap.
We will continue, very selectively, to invest in gas as a transition fuel. This is because the pathways to net zero by 2050 will be different in Africa and South Asia to those in developed economies. While developed economies are challenged to reduce emissions immediately, in many African and South Asian countries, governments are committed to a somewhat later peak in emissions as they tackle important human development needs such as reducing poverty, improving living standards and increasing energy access, to meet the SDGs. However, we will only make these investments in cases where it aligns with a country’s pathway to net zero emissions by 2050, as set out in our Guidance on Natural Gas Power Plants.
Switching on our energy investments
Beyond providing data on the amount of capital committed to our energy investments, it’s also important to explain what this means for the amount of renewable energy being generated by our portfolio. Building a portfolio of renewable energy investments takes patience and commitment, because big infrastructure investments take time to become operational. From the concept of the idea, developers then need to secure financing, land and permits, and then construct the plant and make it operational. This can take years, particularly in countries where the regulatory structure is unclear or unsupportive. This means there can be a lag between the point of our investment and the point at which those power plants begin to supply power.
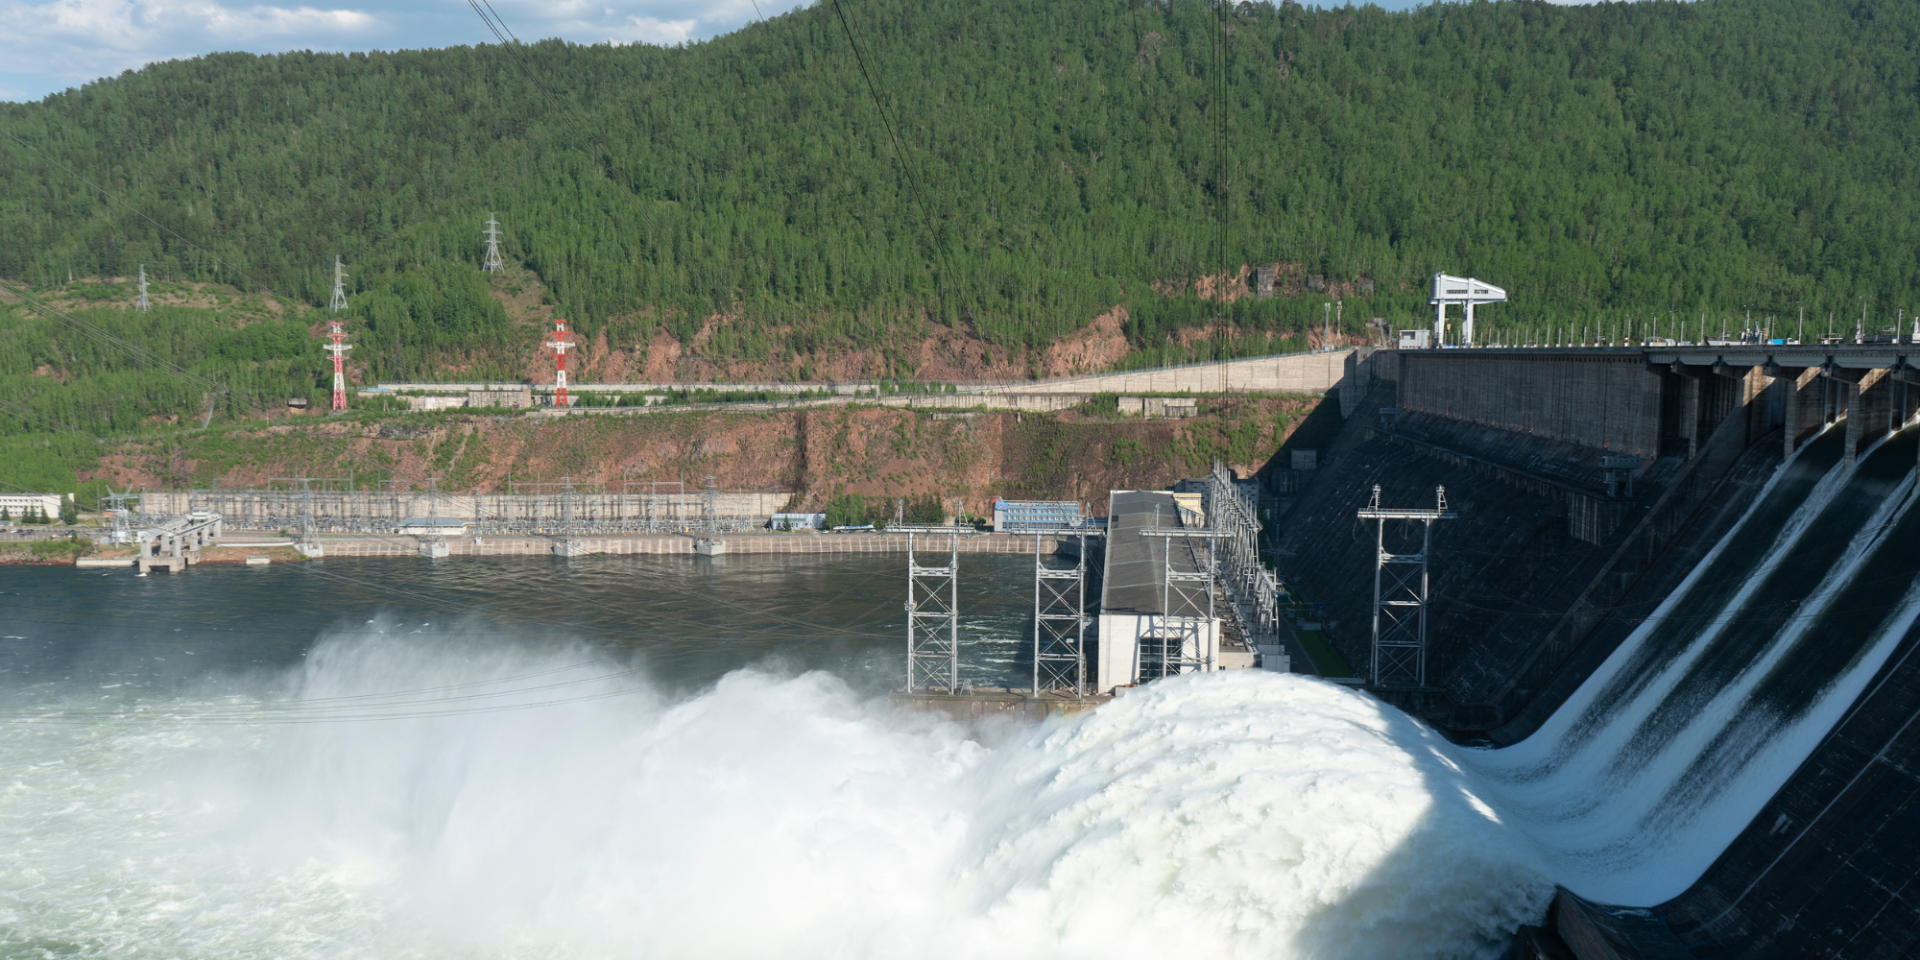
For example, in 2017 we invested in Zephyr Power, a renewable energy company in Pakistan that has developed a 50-megawatt wind-power plant; and in Benban Solar Park in Egypt, the largest solar park in Africa. We’re now starting to see the impact of investments like these within our portfolio as they become operational. Of the total power generated and distributed by our investments in 2020, 29 per cent was from renewable sources such as solar, wind and hydro. This is almost double the proportion generated in 2019, partly the result of some significant renewables projects becoming operational.
Looking ahead
In the years ahead, our total commitments to renewable energy will continue to increase, the value of our fossil fuel portfolio will continue to decrease as these investments exit the portfolio, and at the same time we expect the proportion of renewable energy produced by our portfolio to continue to rise.
Our goal is that by 2050, or earlier if that is the national plan, the countries we invest in will be powered by 100 per cent renewable energy with the accompanying electricity storage to make this possible. The commitments we made at COP26 and our new 2022-2026 strategy will help us to deliver these ambitions.
Notes
Summary of data
Renewable energy – direct investments
Total commitment (USD) 894,022,496
Total NAV (USD) 680,659,086
Fossil fuel energy – direct investments
Total commitment (USD) 468,038,217*
Total NAV (USD) 663,929,451
[*Commitments in the dataset show as $548,038,217, but commitment to Early Power Limited has subsequently been cancelled]
Renewable energy – indirect investments
Total NAV (USD) 273,551,238
Fossil fuel energy – indirect investments
Total NAV (USD) 129,078,190


